Non-Planar Settlement calculations
In an article that I wrote in 2017, I offered to write a post about how to handle settlement analysis when the settlement didn´t fit to an optimal cosine curve. Here it is that post.
Let´s see examples of tanks showing different settlement patterns. All of the tanks were in the same tank farm and are real. All of the tanks had 8 points measured.
By reading this, you´ll get a feel of the settlement analysis in tank shells.
THE TANK WITH AN OPTIMAL COSINE CURVE
D=35ft
H=30ft
L=13.74ft
Material = A36
Y = 36000
E = 29000000
The data measured is the following.
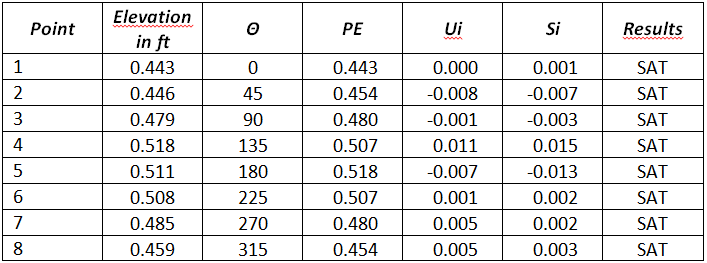
All the points are satisfactory comparing to the allowable settlement calculated from the formula.
Smax =((L^2*Y*11)/2*(E*H)) = 0.043in
Also, a curve exists for this data for which R2 = 0.989
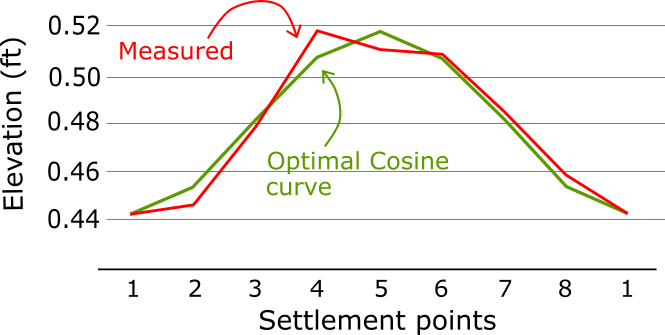
There is nothing to see here. Everything is fine with this tank. If you don´t understand why, go to the article I mentioned above.
THE TILTED TANK
D=25ft
H=24ft
L=9.82ft
Material = Unknown
Y = 30000
E = 29000000
The data measured is the following.
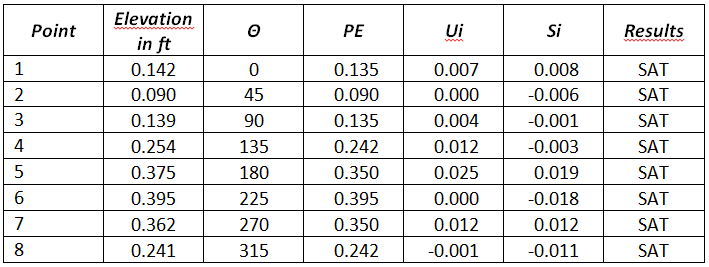
All the points are satisfactory comparing to the allowable settlement calculated from the formula.
Smax =((L^2*Y*11)/2*(E*H)) = 0.023
Also, a curve exists for this data for which R2 = 0.998
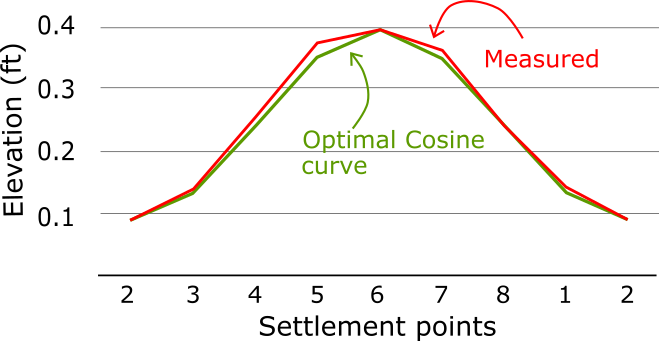
Then the settlement is fine.
However, notice the big difference between the highest and lowest point. 93mm. The tank is tilted.
The tank had some 10 years in operation like that. More assessment was recommended. Also, the owner was made aware of the lack o capacity of tilted tanks.
THE TANK IN WHICH ONE POINT IS UNSATISFACTORY
D=20ft
H=24ft
L=7.85ft
Material = Unknown
Y = 30000
E = 29000000
The data measured is the following
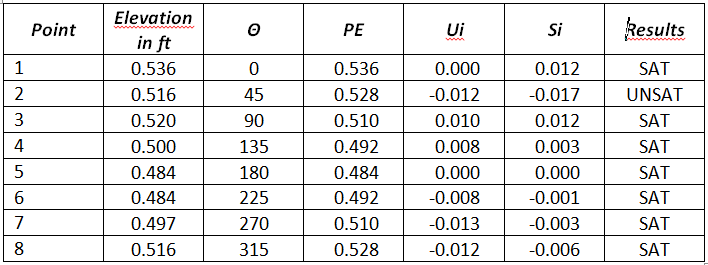
Point #2 has a settlement that is higher than the calculated by the formula
Smax =((L^2*Y*11)/2*(E*H)) = 0.015
But a curve exists for this data for which R2 = 0.926
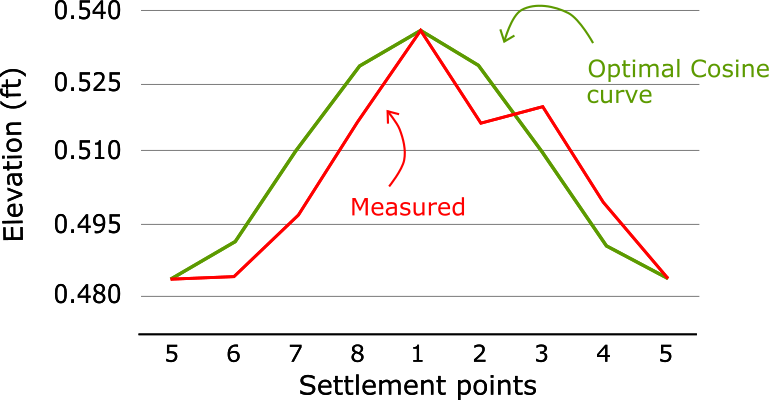
We still need to prove that point 2 meets the settlement criteria. How do we tackle this?
We must measure the maximum out of plane settlement directly from the curve, using the method mentioned in the document “FINAL REPORT ON THE STUDY OF OUT OF PLANE TANK SETTLEMENT” by Andreani. As there exists a close cosine curve, then the graphical method takes that cosine curve into consideration.
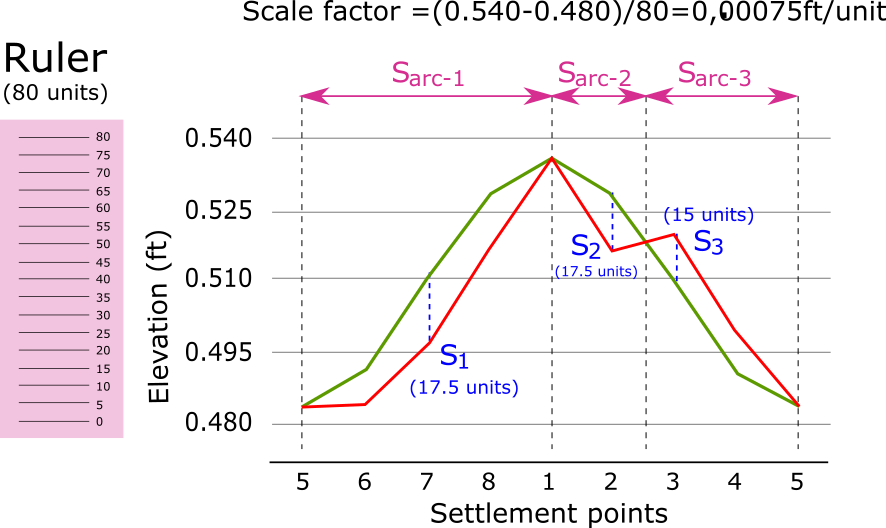
I measure the settlement with an image ruler I made in autocad and pasted in Excel. In this case, as there is an optimal cosine curve, you would compare against that cosine curve. The following is the image I made where I lay out the different variables that go into the calculation. The dotted lines need to be where the cosine curve intersects the data curve.
We will use the procedure in B.3.2.2, using the formula.
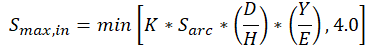
The meaning of each variable in this equation is explained in B.3.2.2 of API 653
The results are tabulated below
Point #2 is definitely out of limits. Partial relevelling, repair or a more torough assessment is needed.
THE TANK WITHOUT AN OPTIMAL COSINE CURVE
D=45ft
H=96ft
L=29.85ft
Material = A283 C
Y = 30000
E = 29000000
The curve for these data shows an R2 = 0.649, which is less than 0.9. The settlement fits poorly to a cosine curve.
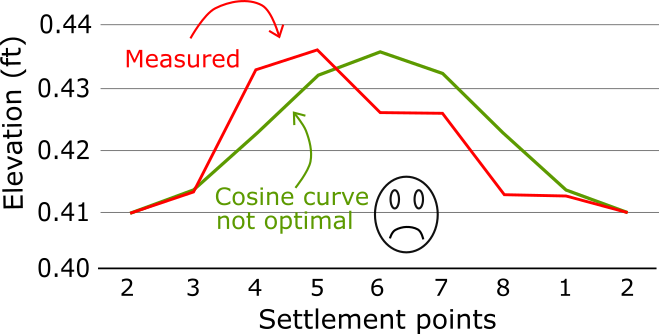
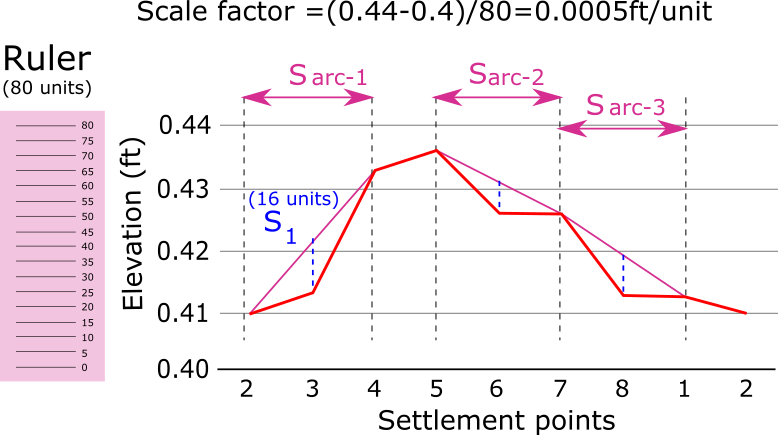
Then you must measure the maximum out of plane settlement directly from the curve, using the method mentioned in the document FINAL REPORT ON THE STUDY OF OUT OF PLANE TANK SETTLEMENT” ” by Andreani. There is no cosine curve this time.
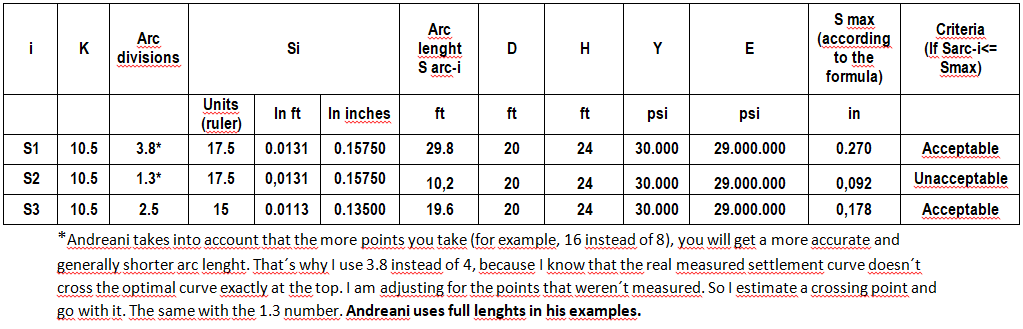
I measure the settlement with an image ruler I made in autocad and pasted it in Excel. The following is the image I made where I lay out the different variables that go into the calculation. The dotted lines need to be where the curve changes direction.
We will use the procedure in B.3.2.2, using the formula.
The meaning of each variable in this equation is explained in B.3.2.2 of API 653
The results are tabulated below. As S1 is obviously the biggest, there is no need to check S2 and S3.
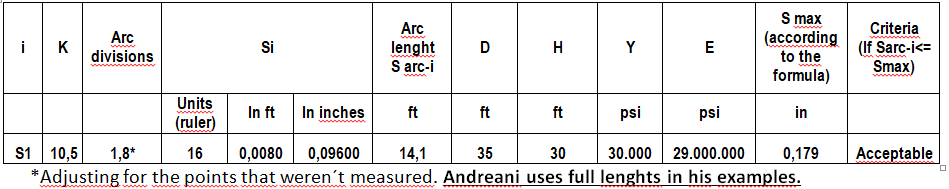
The the settlement is acceptable in each point.
All of this will go into a video course I am preparing about taking the API 653 exam and passing it all along. This video course will also sharpen your inspection skills once you are certified.
Leave a Comment